Dashboards

Contents
The Dashboards option allows your DSR to view business related graphics and data. You can view your numbers for Sales and Costs using multiple variations for time periods.
You have 3 data tabs available:
•Total Sales
•Sales by City
•A/R Overview
You have these time period options:
•Year and Quarter •Year and Month • Last 7 Days |
|
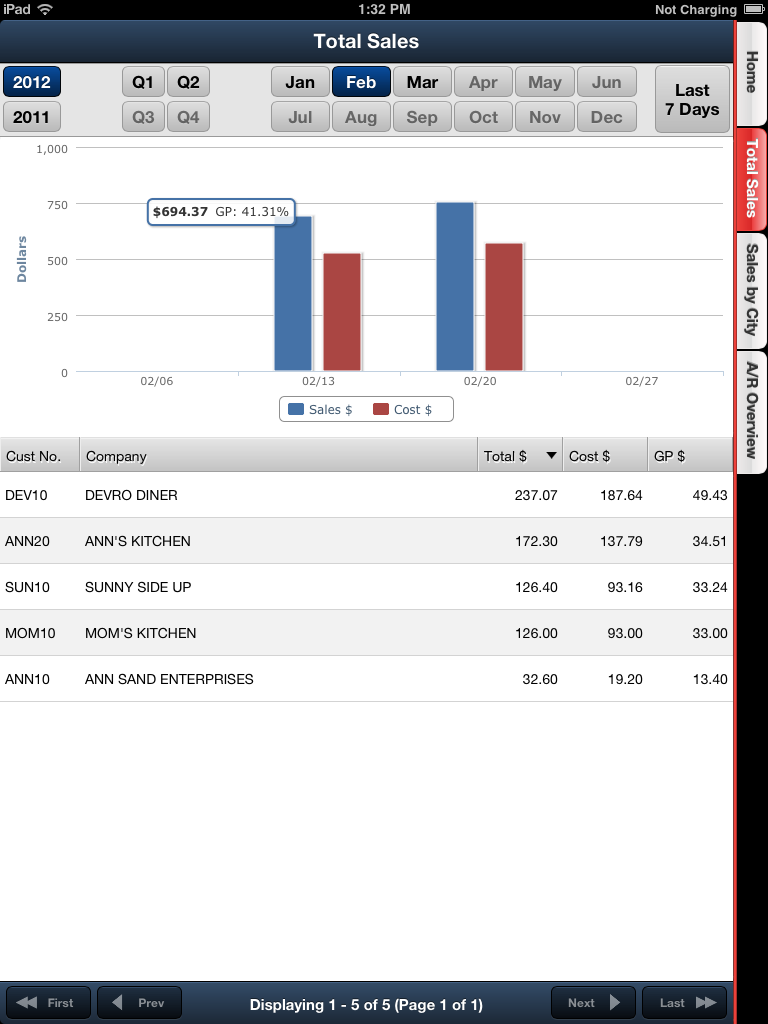
Total Sales Tab
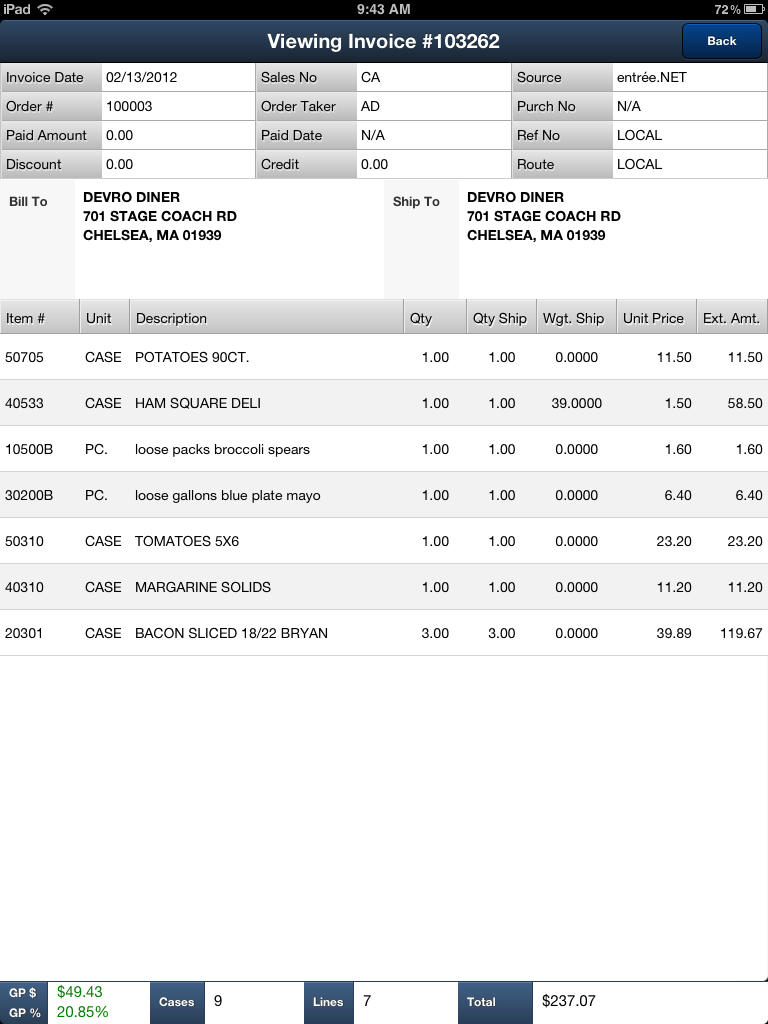
Once the time period is selected tap a column to view the detailed sales or cost numbers. A list of customers will display with their sales, costs and gross profit numbers.
Tap a customer to see how many invoices their numbers represents in the lower section of the screen.
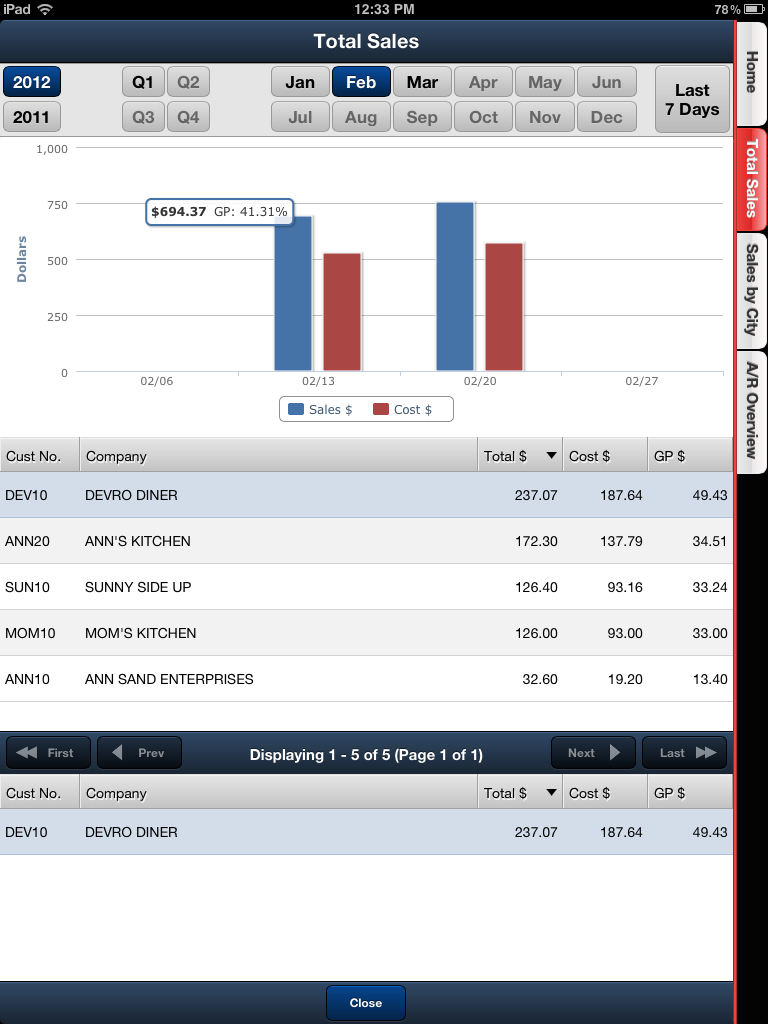
•Then tap an invoice in the lower section of the screen to view the invoice details as read only.
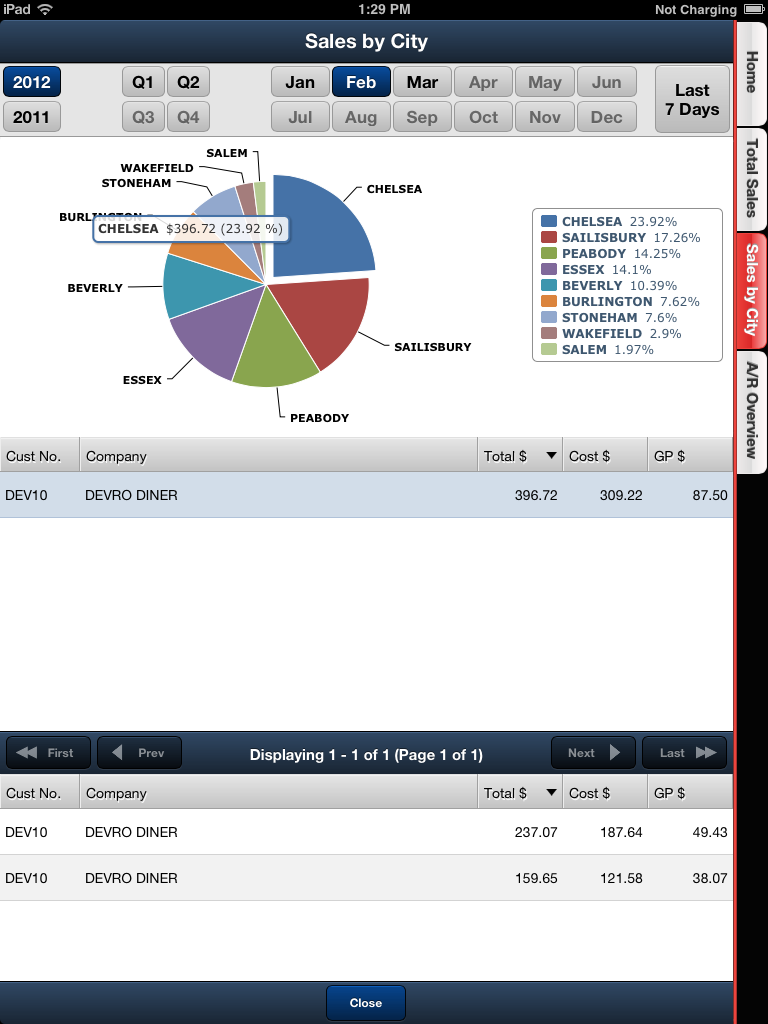
Sales by City Tab
When the time period is set tap a section of the pie chart to view the detailed sales and cost numbers for that city. A list of customers will be display with their sales, costs and gross profit numbers that make up that section of the pie chart. Tap the customer to see how many invoices their numbers represent in the bottom section. Then tap an invoice to view the details.
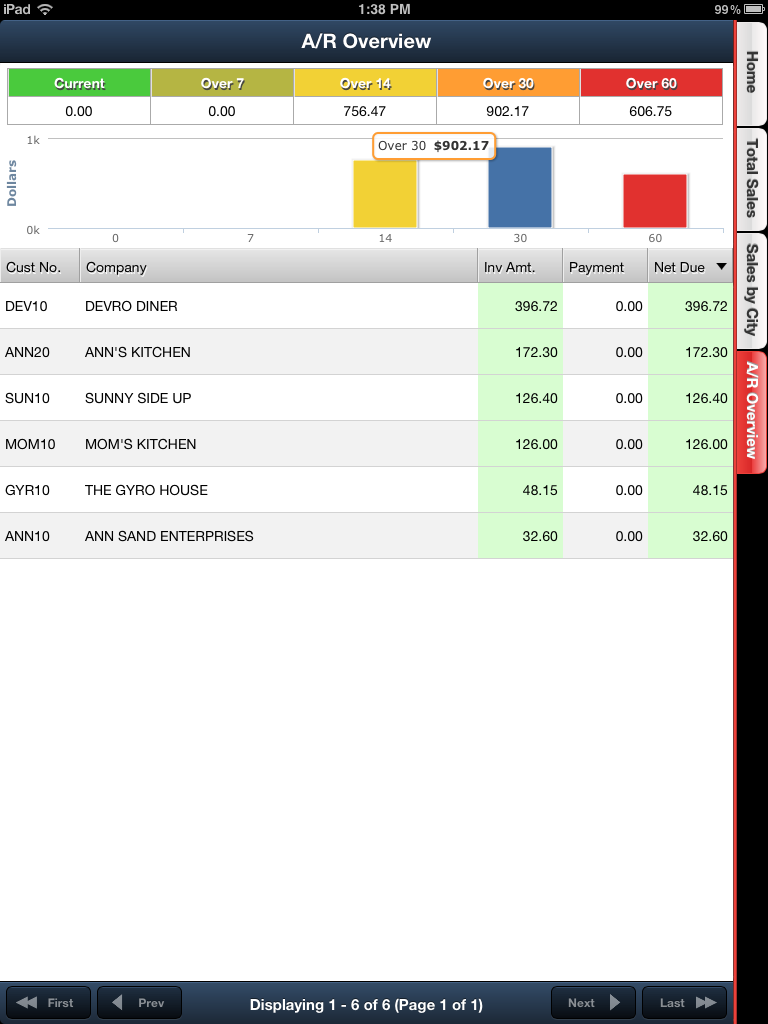
A/R Overview Tab
An overview of your DSR’s A/R (Accounts Receivables) status for periods from zero through 60 days will be displayed when the A/R Overview tab is selected. Tap a column to view the detailed A/R numbers and list of customers with that A/R status. Tap the customer to see how many invoices their A/R status represents. Then tap an invoice in the list to view the invoice details.