Expiring Lots Utility
The Expiring Lots Utility is designed to review the data in the Lot File and identify items having a non-blank "Expiration Date" value.
Access
Use menu path: Inventory > Expiring Lots.
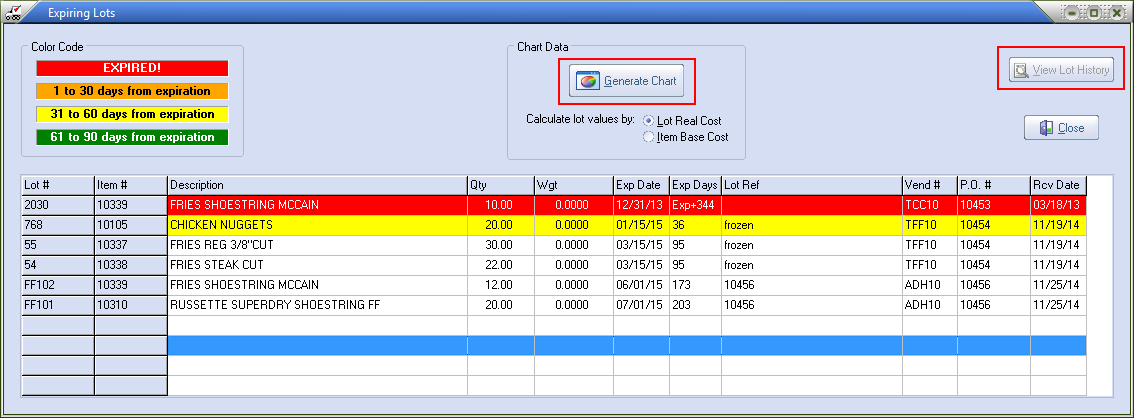
The Expiring Lots Utility uses the current System Date and compares it to each Lot Expiration Date. Lots are categorized into one of five groups:
| 1. | Lots which are past their defined Expiration Date |
| 2. | Lots which fall into one of three age groups which are: |
a. fixed at 30 days
b. fixed at 60 days
c. fixed at 90 days
| d. | In the display grid the lots falling into each of the four groups mentioned in #1 and #2 are highlighted in a specific color: Red for expired, Orange for 30 days or less, Yellow for 31-60 days and Green for 61-90 days. |

| 3. | Lots with a remaining life expectancy which is beyond the 90 day category. Lots that are more than 90 days away from their Expiration Date will be shown normally. |
▪
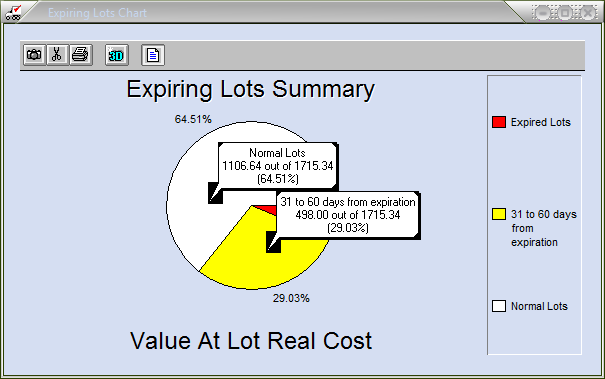
| 4. | To create and display a graph which summarizes the information presented in the Expiring Lots list using the Chart Data Option. entrée will only graph lots with a defined expiration date. All other lots, as well as non-lot items, are excluded from this data display. |
| a. | Click to select between valuing the lots according Real Cost or Base Cost from the inventory item. |
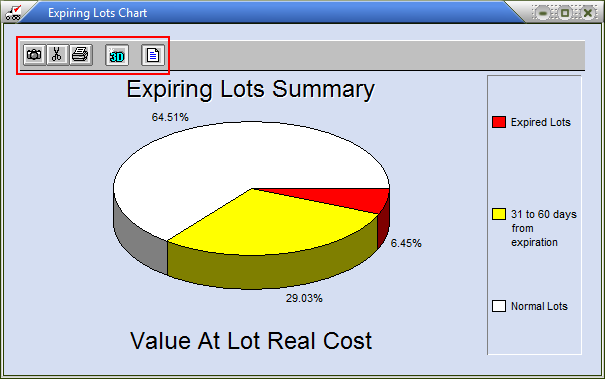
| b. | Click the Generate Chart button. The chart represents the inventory by value. |

| c. | The graph toolbar allows the user to: |
▪Copy or cut either the graph image itself or the underlying data.
▪Print the graph back on the main lot listing.
▪Switch between a 2D and 3D (above) representation by clicking the button.
▪Show or hide the legend bar.
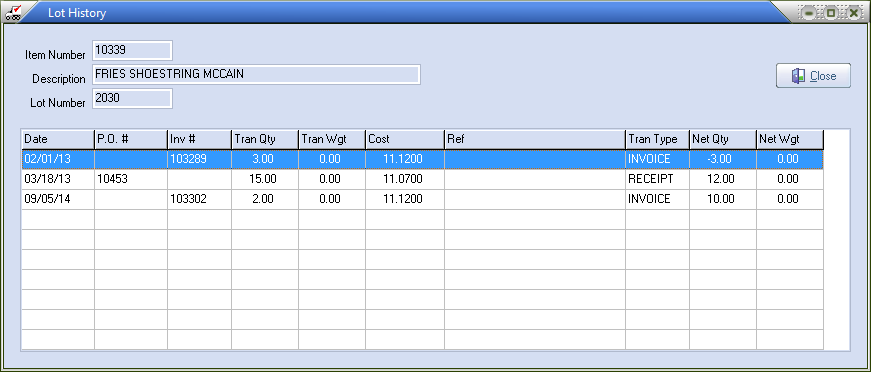
▪Users can highlight an Item/Lot combination on the list and either double-click, press the Enter key or click the "View" button to see a Lot History listing for that specific lot.

Viewing Lot History
| 1. | Select the lot item in the list |
| 2. | Click View Lot History button |
| 3. | Click Close when done |

