History Graphs & Charts

Contents
•Trending can be a very useful tool to a purchasing department. Through the use of graphs, buyers can see upward or downward trends in purchases to a particular vendor. This becomes especially important if your cost is based on a certain dollar amount purchased.
•You can use graphs to easily determine if you need to increase purchases to this vendor in order to maintain your present cost level with them.
•Or, you may be able to decrease purchases from this vendor (without losing your favorable prices) to gain a better price level from another vendor.
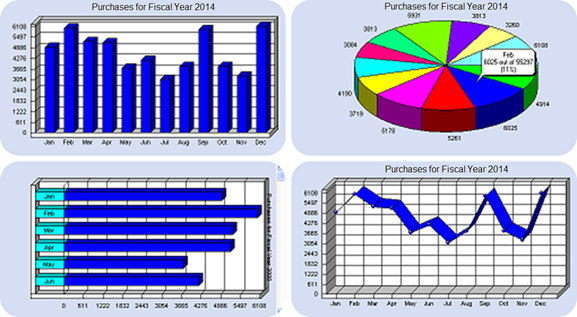
That is why entrée includes graphical representations of the historical data. It is much easier to see trends when looking at graphs and charts than looking at numbers in a table. There are many different styles of charts and graphs from which to choose. You can experiment with these until you find one that suits your needs.

Right clicking on any section of the graph will show a bubble caption. This bubble caption contains an exact numeric purchases value for the given period. The bubble caption also includes a percentage of the total purchases when using the pie-chart style graph.