Using Dashboard Features
entrée Version 4 introduces the Dashboards feature that we built from the ground-up and was made possible by our move to the SQL database platform. Dashboards are the ultimate tool for organizing and analyzing your business data.
The actual term for our dashboards is called a "Pivot Grid" or "Pivot Table", which is commonly used in business intelligence software. This tool helps the user recognize data patterns that help to build advanced data models quickly. With pivot tables, users can define and store sets of categories, then change views by dragging category names with the mouse. This core functionality provides the model for pivot tables which we have embraced in the entrée V4 SQL Dashboards. It provides a highly flexible means for a food distributor to analyze and grasp trends from the mountains of complex data which is normally lost by simply printing reports.
You will find a Dashboards  or Sales
  button integrated into the Inventory, Customer, Vendor, Salesperson, Brand and Class File Maintenance screens. The main function is to summarize large amounts of information and represent it in a cross-tabulated form.
For instance, you can analyze sales during specific periods (years, quarterly intervals, months, weeks) for each customer, item, vendor, salesperson, brand or class, many of the dashboards include "drill down" features which allow you to see specific information, such as all the line items of a selected invoice.
The dashboards allow you to visualize your data by summarizing into different charting diagram styles including: pie charts, line charts, bar charts and area charts.
Dashboards have an interactive control, permitting you to easily reorganize and modify the layout using drag-and-drop. As a result, your business data will be re-summarized according to the new layout of the column and row fields, so an end-user can easily alter a report to display the information they need in the way they need it. Your dashboard configurations can be saved and loaded for sharing with other users in your company.
Reporting
The Dashboards feature includes full reporting capabilities, so you can easily print to paper or export to Excel or HTML. Advanced data filtering is also provided for more sophisticated users.
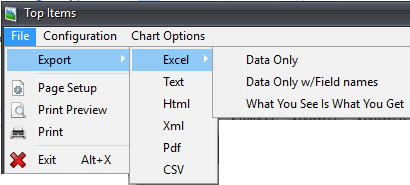
The File > Export menu in all dashboards has expanded the options to include CSV and two Excel options. •Data Only: Exports Excel data only. •Data Only w/Field names: Exports Excel data only with field names. •CSV: Exports as CSV (comma-separated values text file). These enhancements provide you with the flexibility to export dashboard data from entrée for input to Excel and other software packages. |
|
•The following topics are covered in the rest of this chapter to fully demonstrate the use of dashboards within the system.

